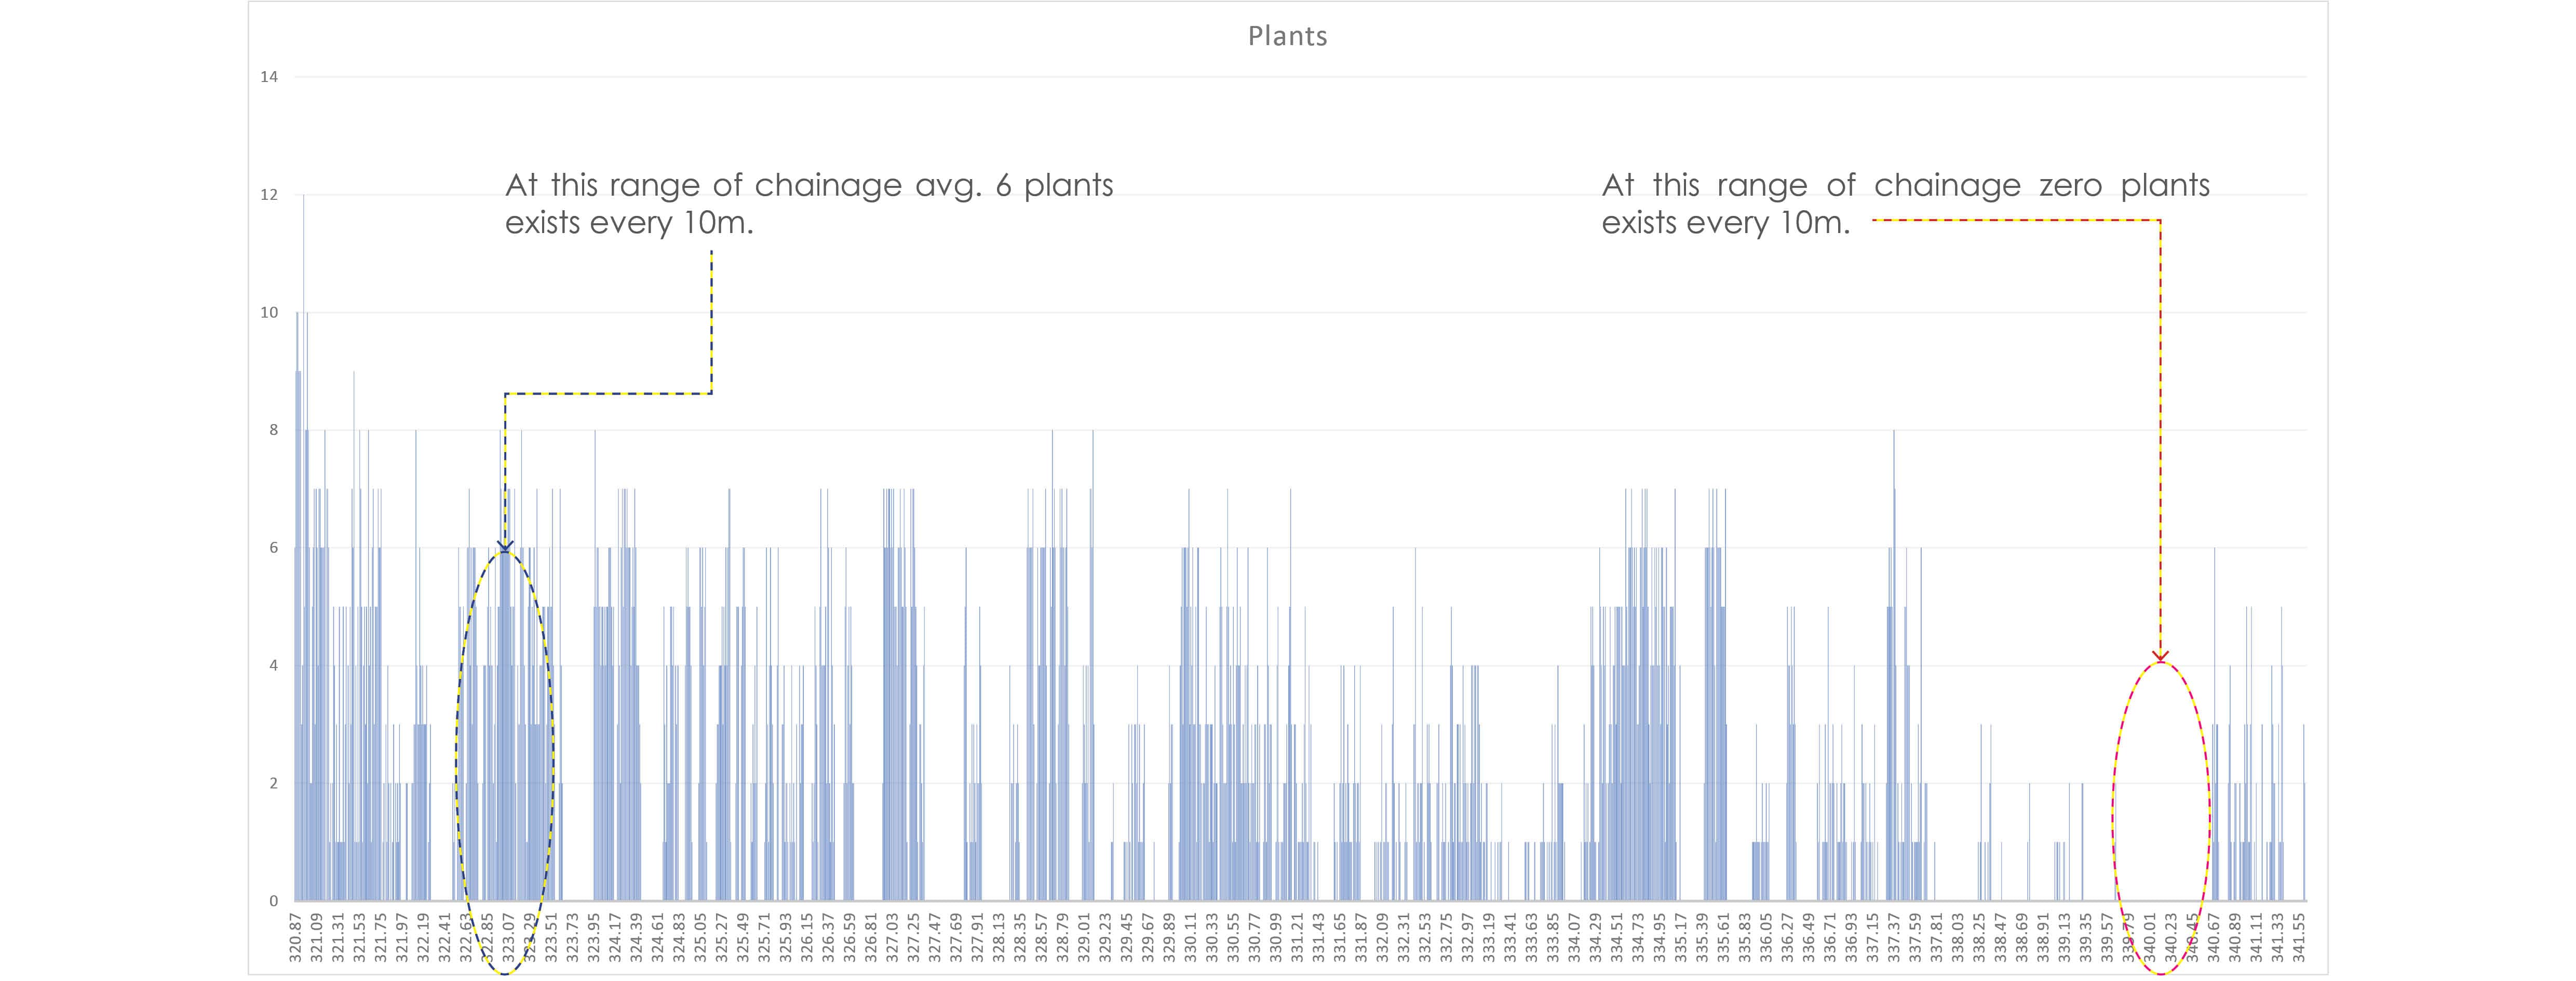
Median Plantation
This is a simple representation of the linear median plantation data. The X-axis represents chainage at every 10m & Y-axis represents the number of plants per 10m. The below graph represents the 9km data for median plantation.
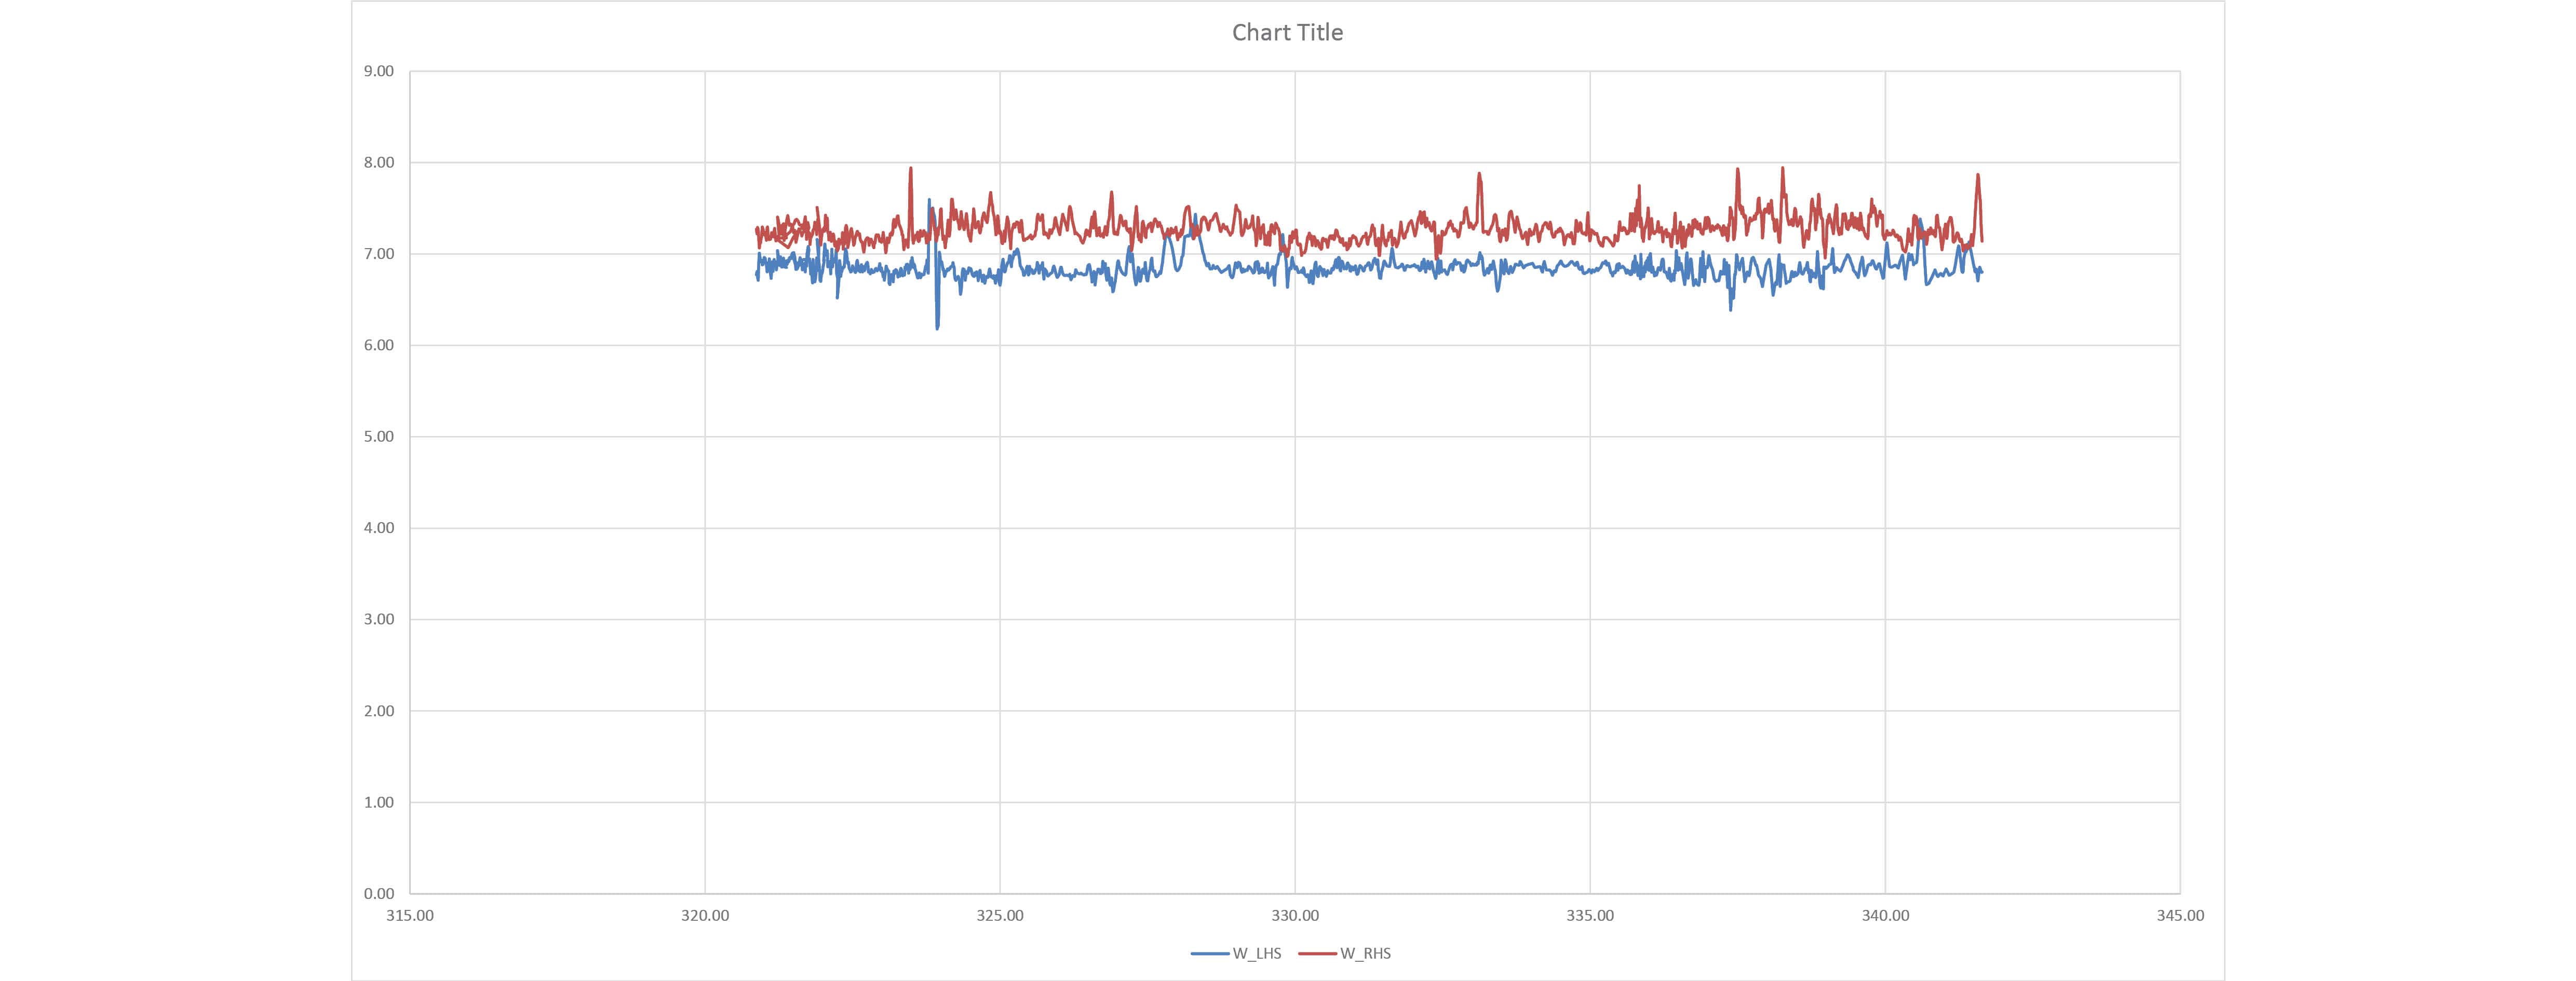
MCW Width
This graph represents the width of the Main Carriage Way for LHS & RHS respectively. The X-axis represents the Chainage @ 10m & Y-axis represents the width of MCW. Blueline represents the LHS & Red represents RHS.
Service Road
This graph represents the provision of the service road in the 9Km stretch. The X-axis represents the Chainage @ 10m & Y-axis represents the width of Service Road. This also represents the service road provided at the given chainage. Blueline represents the LHS & Red represents RHS.
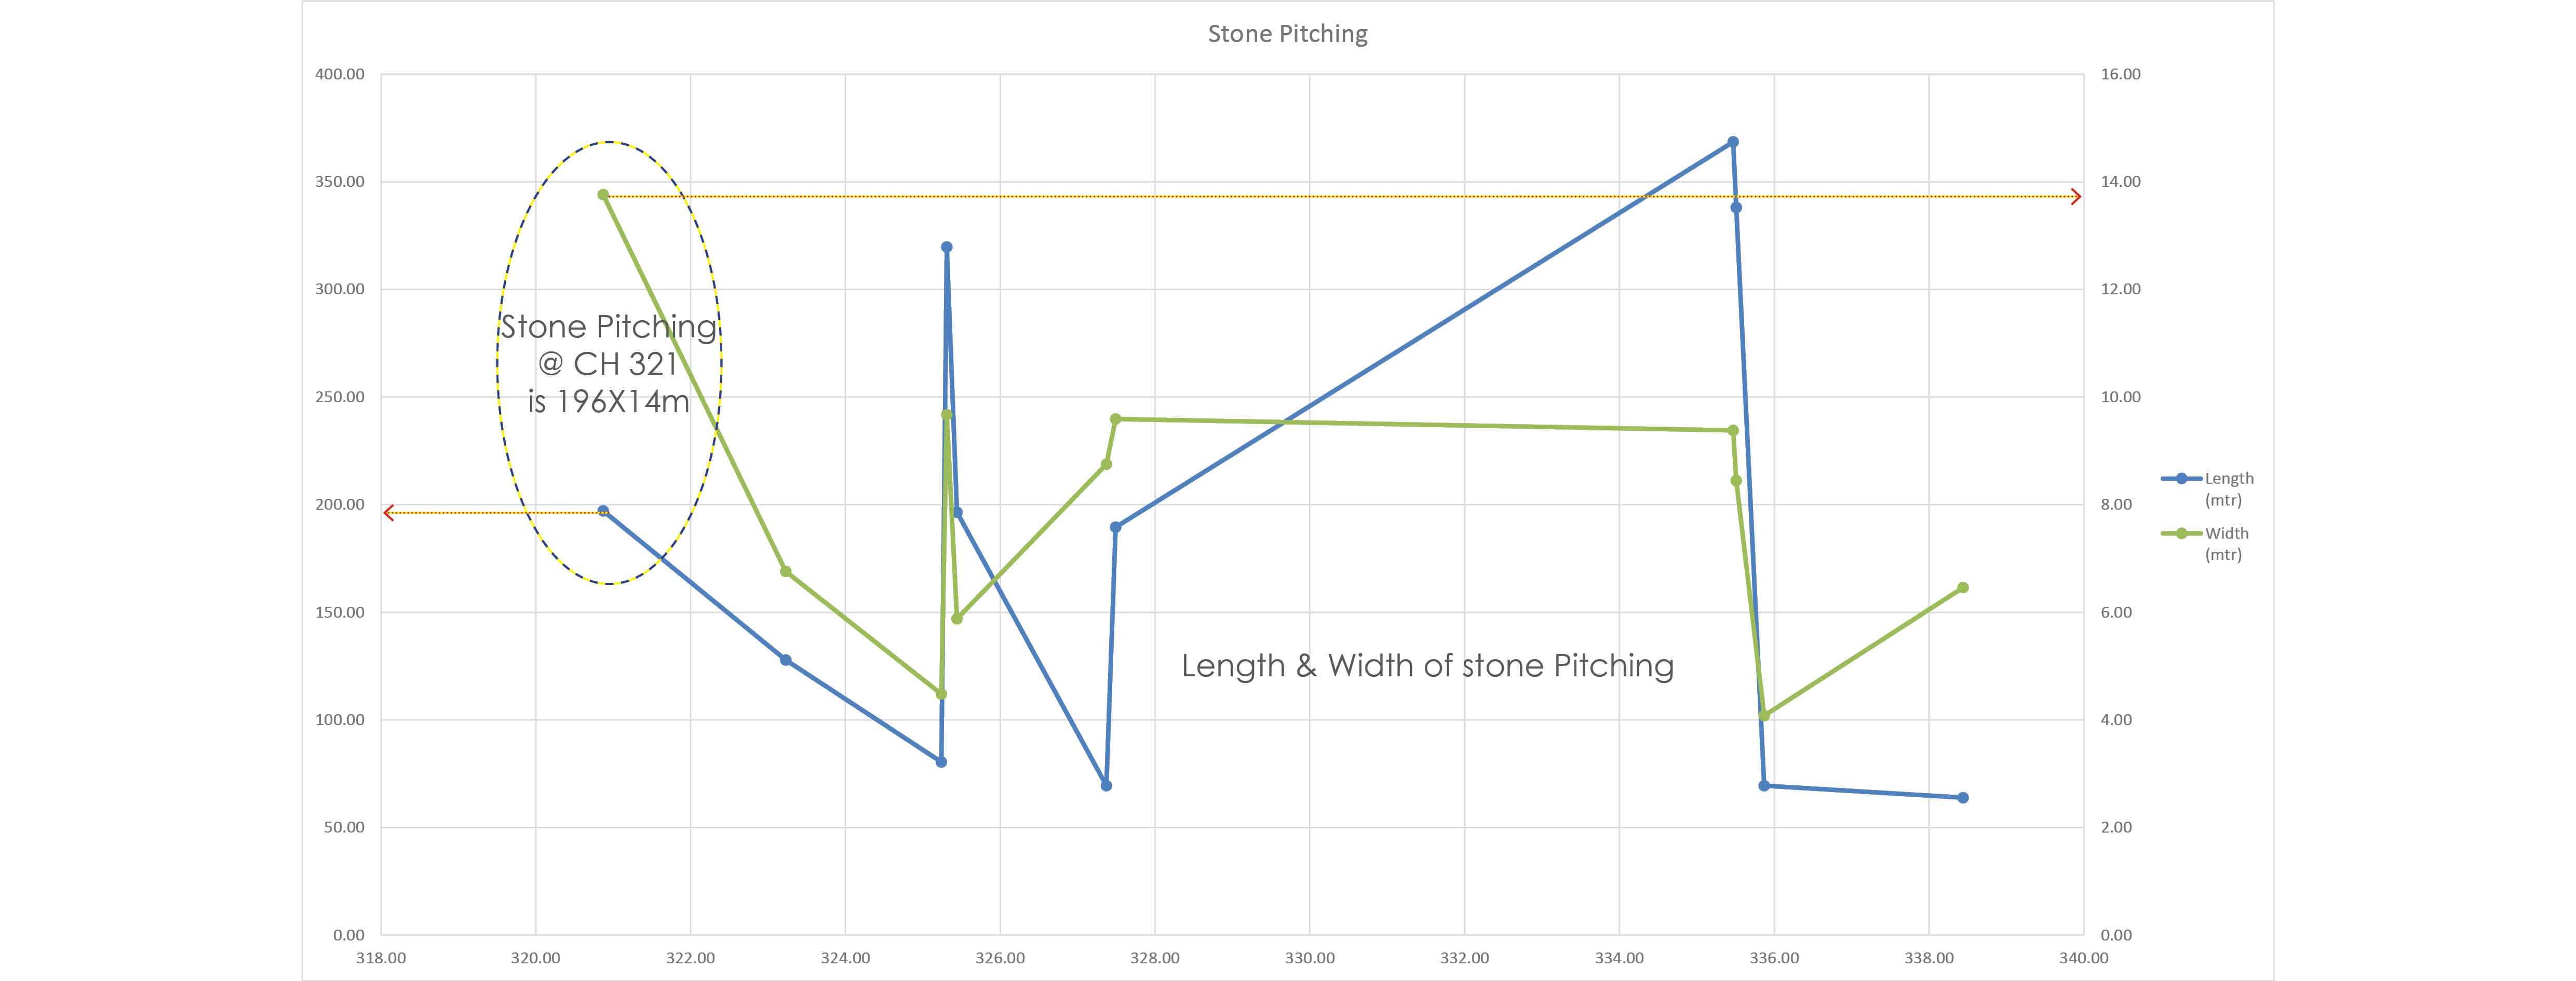
Stone Pitching
This graph represents the existing stone pitching alongside the road. The X-axis represents the Chainage @ 10m & dual Y-axis represents the length and width of the pitching respectively.