Crop Health Assesment
Crop Health Map
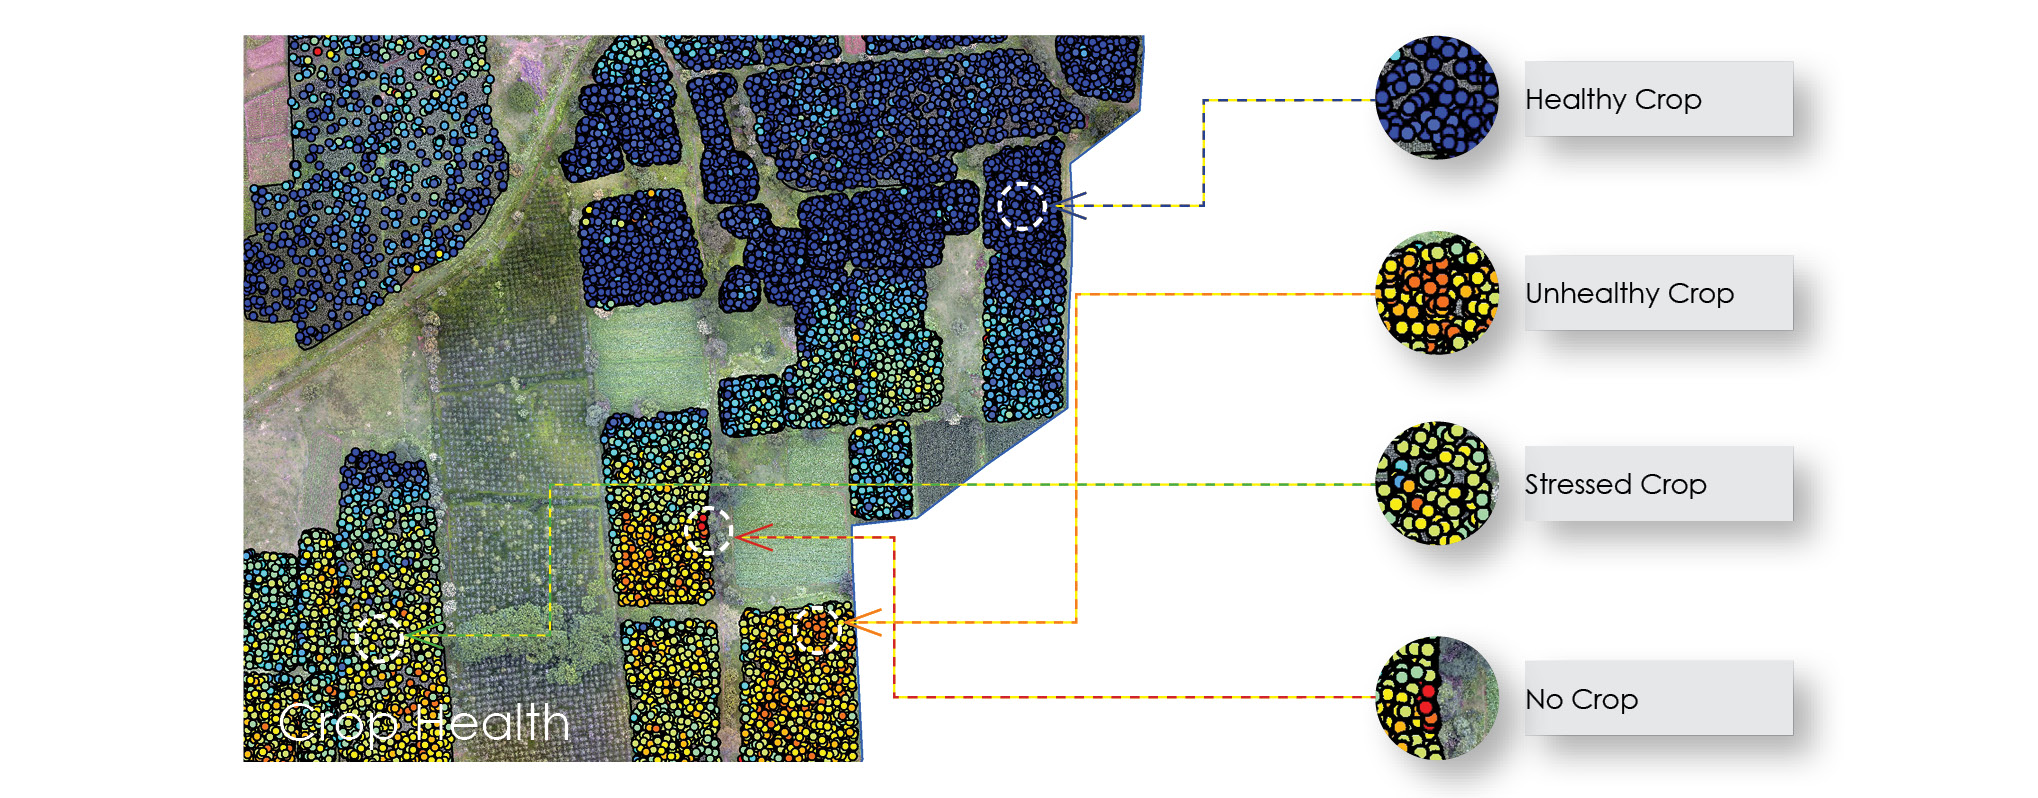
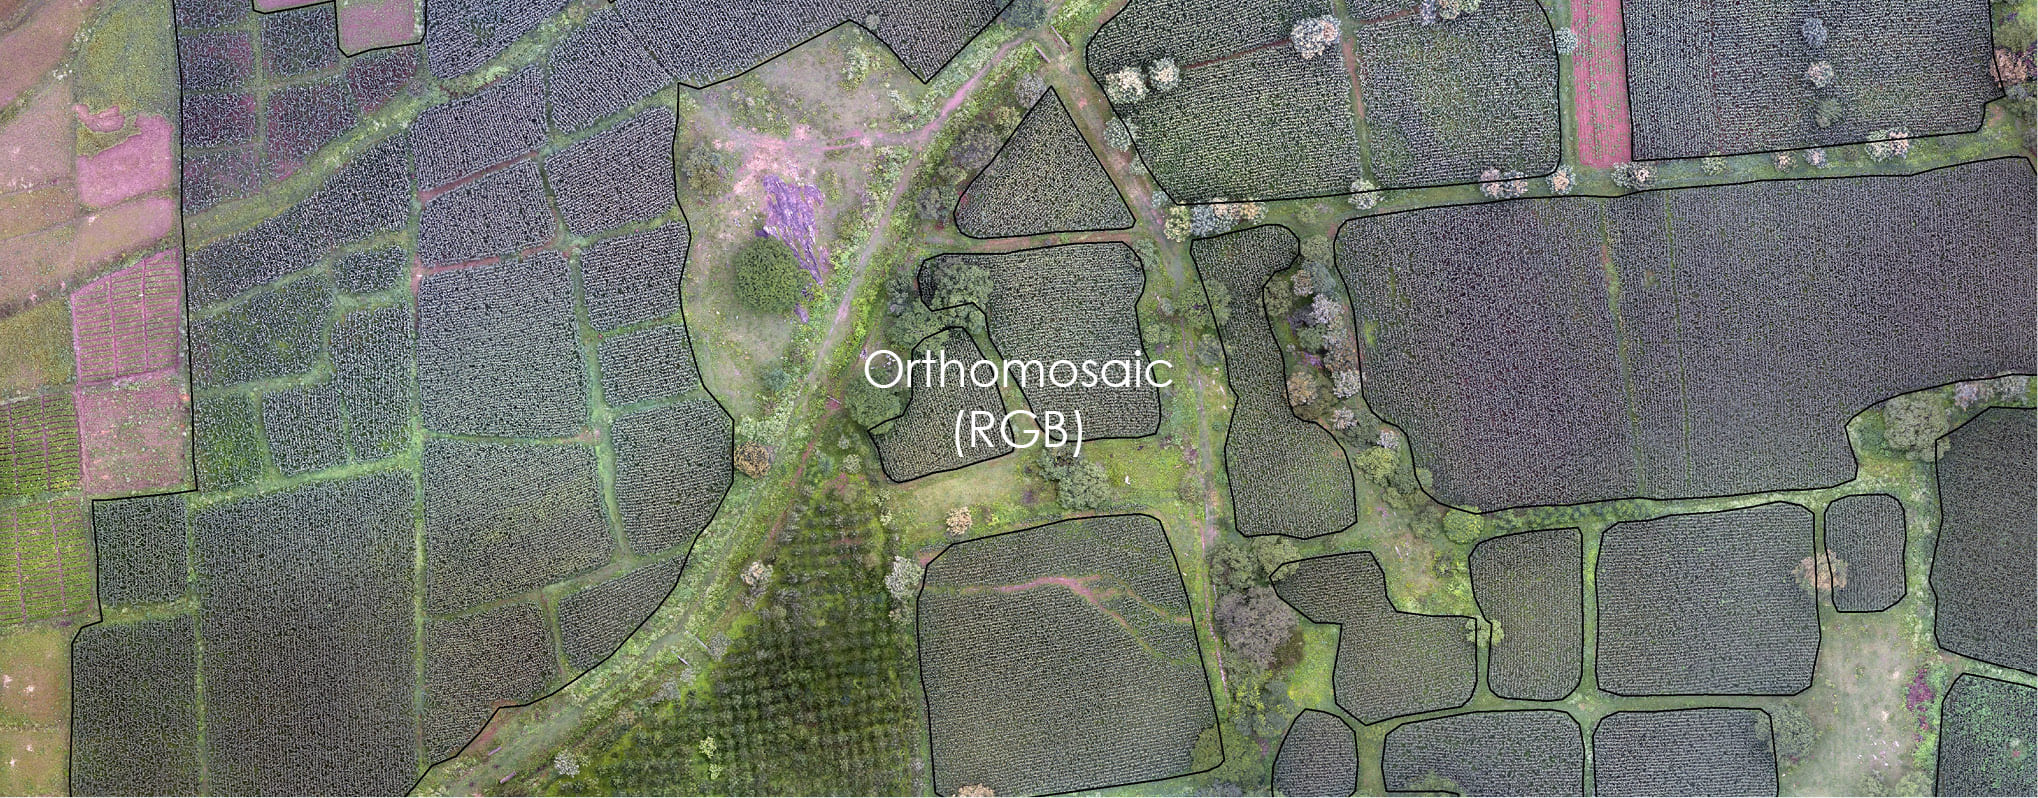
To understand the crop health data, an overlay map is generated to give an easy idea of analysis of the site. The points generated here on the maps carry the crop health information and pinpoint location information with an accuracy of 3 cm (approx).
Stressed Crop Region
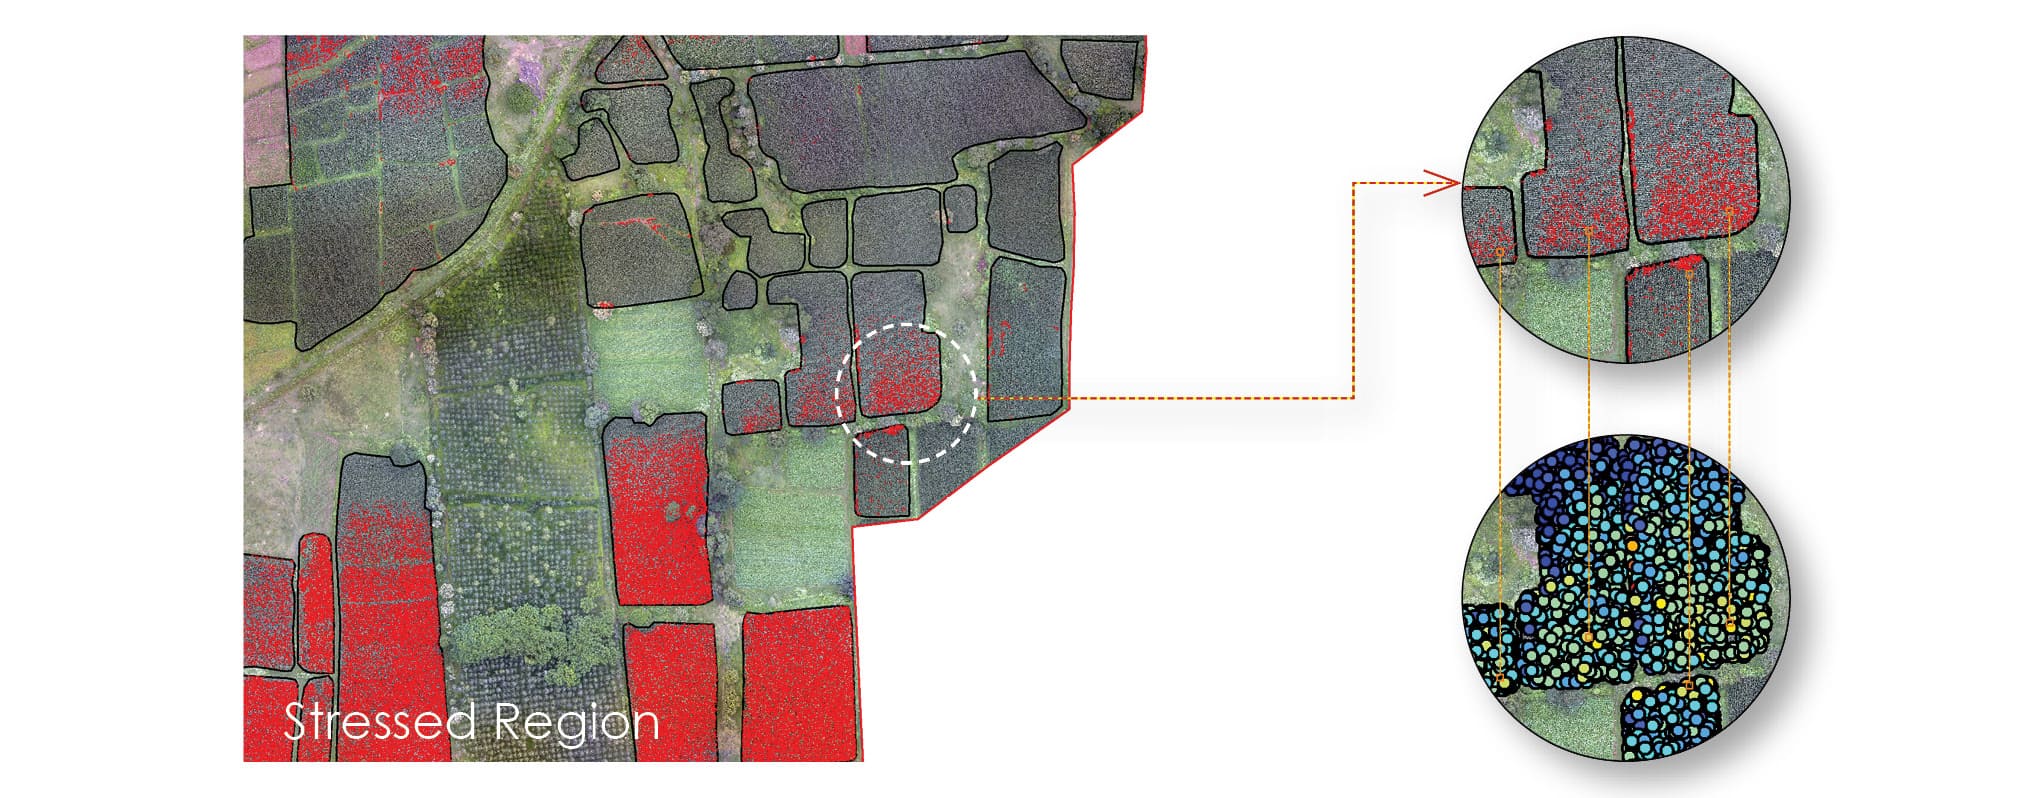
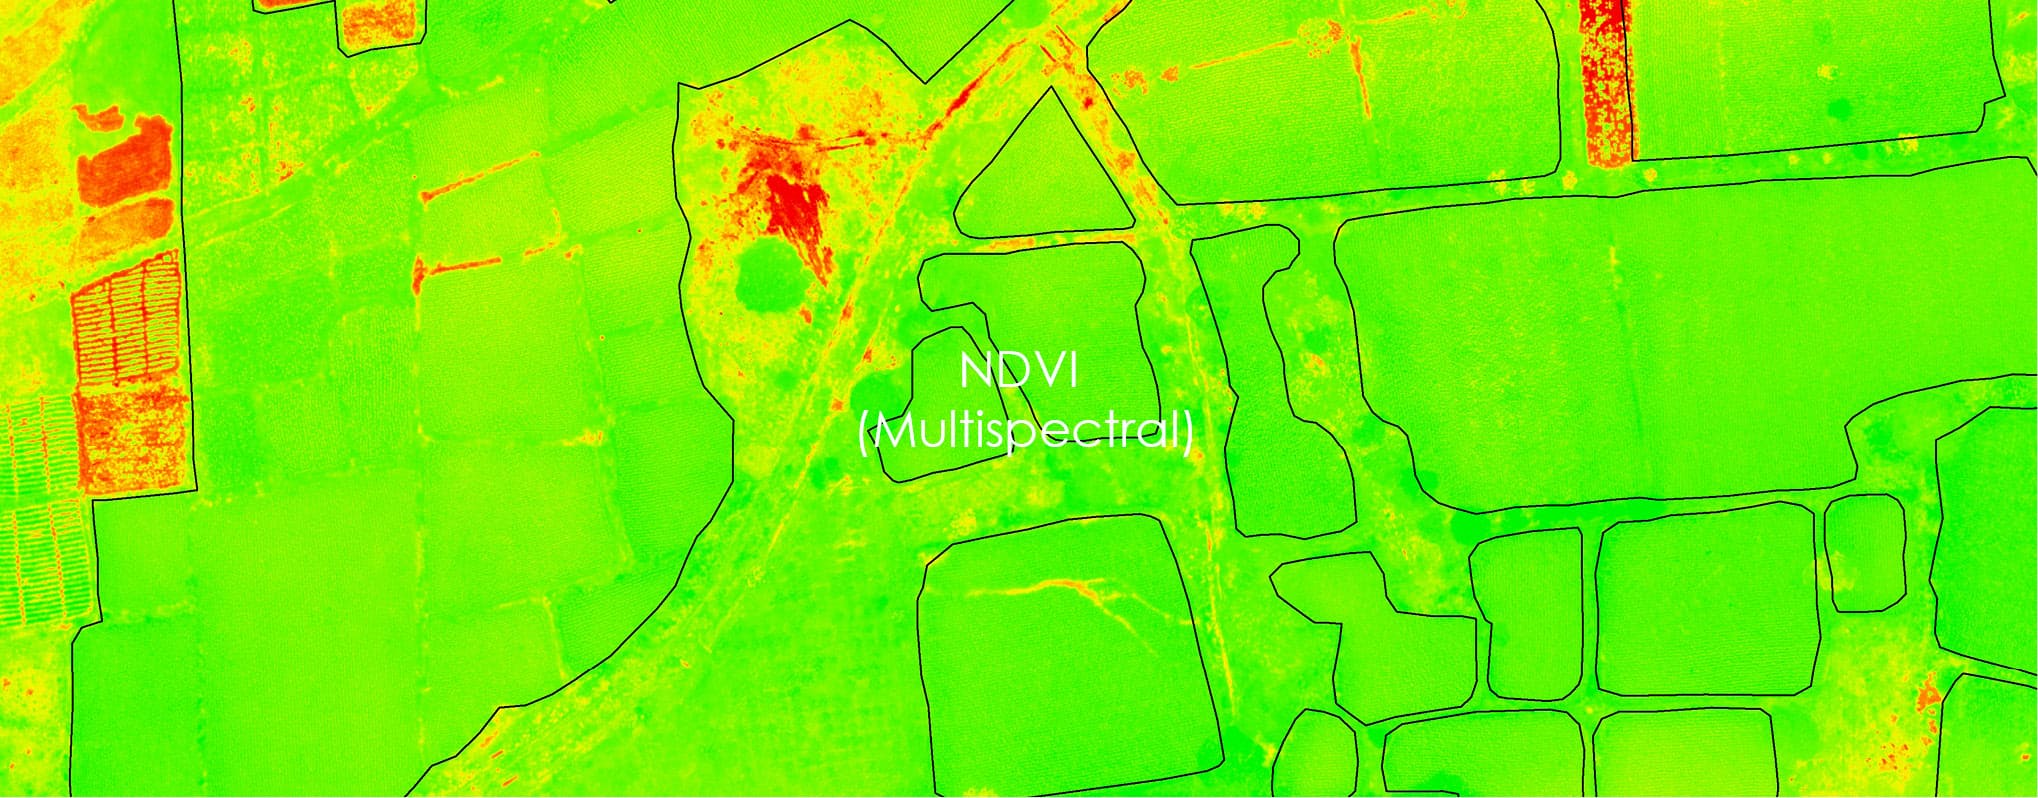
To identify the area of the stressed crop region the random points with the NDVI index values are used. The points indicating the stressed region are extracted and given a buffer of 0.3m (1 ft). From the Orthomosaic, the plant covering radius if 0.3m is observed. These generated buffers are merged to avoid overlaps and miscalculations and generate a crisp area of stressed crop.
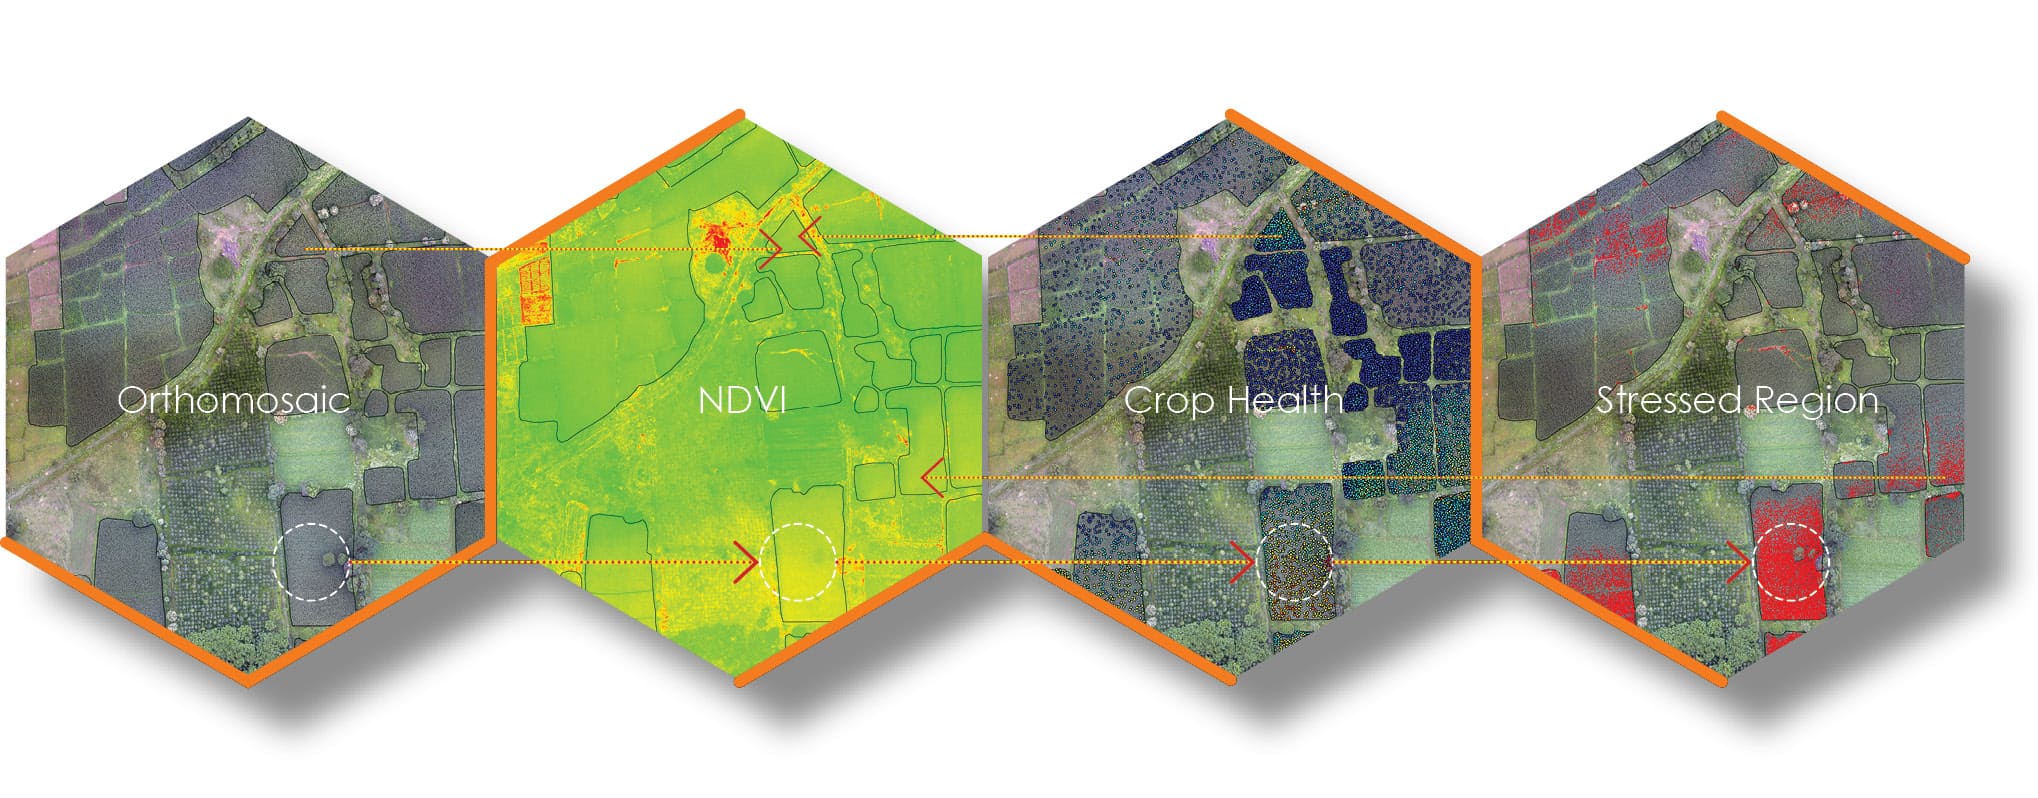
How NDVI Works